
The dirty secret of algorithmic trading is that most backtests are optimistic fiction. A strategy developer selects indicators, tunes parameters, cherry-picks the test period, and presents a stunning equity curve to themselves or their investors. Then the strategy goes live and immediately underperforms — or worse, loses money consistently.
This is not fraud, in most cases. It is the natural result of overfitting — a process so seductive and easy to fall into that even experienced quants must actively fight against it. Walk forward testing and forward optimization are the most reliable tools we have to distinguish real edge from curve-fitted noise.
The Problem With Simple Backtests
A simple backtest works like this: you define a strategy with some parameters (say, a moving average crossover with periods 20 and 50), run it over historical data, and evaluate the results. If it doesn't look good, you adjust the parameters and try again. Eventually you find a parameter set that produces an impressive equity curve — and you declare success.
The problem is that each time you adjusted the parameters, you were implicitly training your strategy on the test data. The final parameter set is not a general solution — it is the specific set that happened to work best on that specific historical period. Take it live, and you are trading a solution to a problem that no longer exists.
“Every time you look at your backtest results and change something, you are training your strategy on your test set. There are no free lunches.”
What Is Walk Forward Testing?
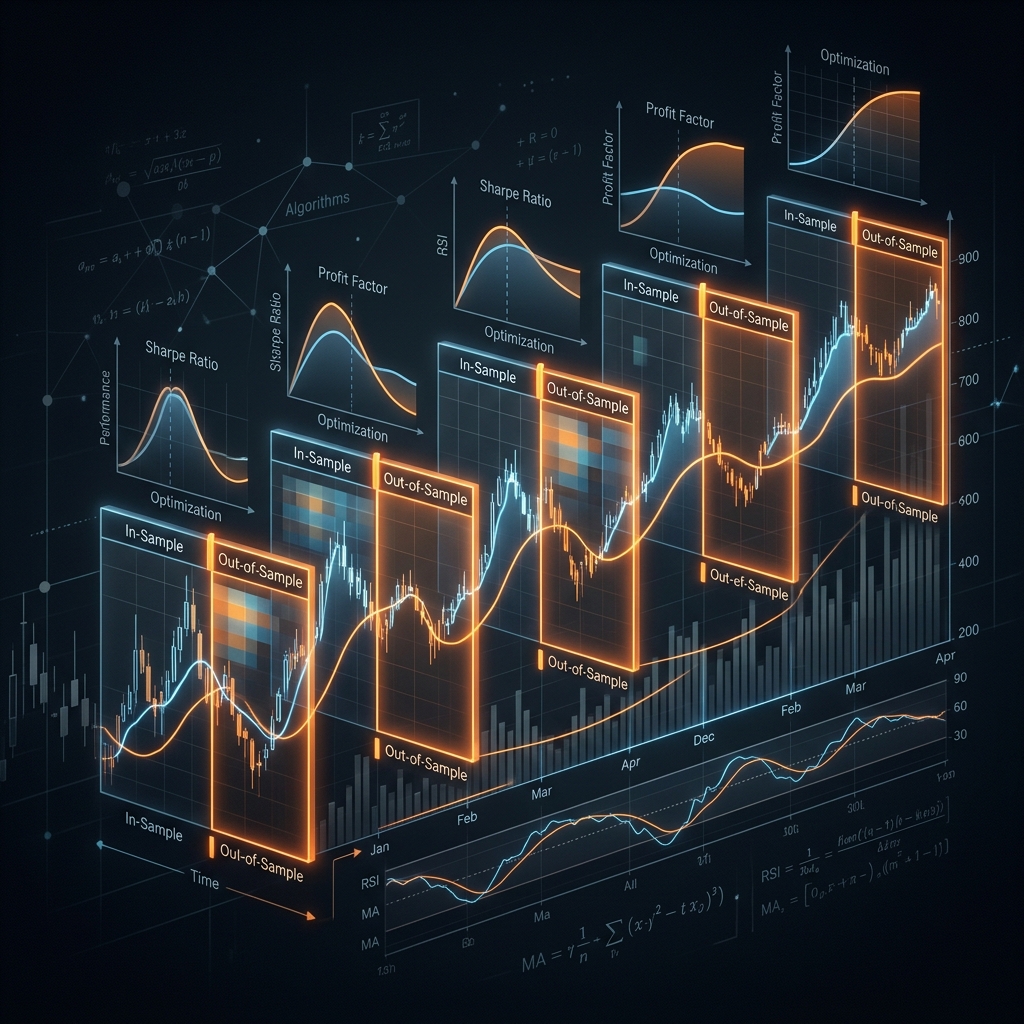
Walk forward testing divides your historical data into a series of sequential windows, each consisting of an in-sample period (IS) and an out-of-sample period (OOS). The methodology proceeds as follows:
- 1Define an in-sample window (e.g., 6 months) and an out-of-sample window (e.g., 1 month).
- 2Optimise your strategy parameters exclusively on the in-sample data — find the best parameter set for that period.
- 3Apply those exact parameters, unchanged, to the out-of-sample period that immediately follows. Record the performance.
- 4Slide the window forward by one out-of-sample period and repeat.
- 5Concatenate all out-of-sample results into a single equity curve — this is your walk forward equity curve.
The resulting OOS equity curve is your honest performance estimate. Because the parameters used in each OOS period were optimised on data that preceded it — not on the OOS data itself — this process genuinely simulates how the strategy would have performed if deployed live, reoptimised periodically.
Forward Optimization: Choosing What to Optimise
Forward optimization is the process of systematically searching the parameter space during each in-sample window to find the best-performing configuration. But 'best-performing' requires careful definition. Optimising purely for maximum return on the IS period is dangerous — it finds the most curve-fitted solution. Better objective functions include:
- Sharpe ratio: rewards consistent risk-adjusted returns rather than raw PnL, discouraging solutions that win big in one part of the IS period and lose elsewhere.
- Calmar ratio: return divided by maximum drawdown — rewards strategies that achieve returns without excessive equity curve deterioration.
- Profit factor with minimum trade count: ensures the optimised solution has statistical significance, not just a handful of lucky large trades.
- Robustness score: the percentage of parameter combinations near the optimal that also produce positive OOS results — a measure of how stable the edge is around the chosen parameters.
The Walk Forward Efficiency Ratio
One of the most useful diagnostics in walk forward analysis is the Walk Forward Efficiency (WFE) ratio — the ratio of annualised OOS performance to annualised IS performance. A WFE of 1.0 means the strategy performs identically on both IS and OOS data, which is ideal (and rare). A WFE above 0.5 generally indicates a robust strategy. Below 0.3 suggests heavy overfitting.
At StockHunt, we treat a WFE below 0.4 as an automatic rejection criterion. No matter how impressive a strategy looks on its IS results, if it cannot deliver at least 40% of that performance on unseen data consistently across multiple walk forward windows, we do not trade it live.
Anchored vs. Rolling Walk Forward
There are two primary variants of walk forward testing. In rolling (or sliding) walk forward, the IS window moves forward through time, meaning older data is continuously dropped. In anchored walk forward, the IS window grows with each step — the start date is fixed and more recent data is added each time.
Rolling walk forward is better for strategies where recent market conditions are more relevant than distant history — common in crypto where structural shifts make data from 3+ years ago less representative. Anchored walk forward is better for strategies with very small datasets where losing older data would make IS periods statistically meaningless. We use rolling walk forward for all our primary crypto strategies.
Common Walk Forward Mistakes
- OOS windows that are too short: A 2-week OOS period may not contain enough trades to be statistically meaningful. We recommend a minimum of 30 completed trades per OOS window.
- Re-examining OOS results before the full test is complete: Once you have looked at an OOS period's results, it ceases to be truly out-of-sample for you. Complete the full walk forward before analysing aggregate results.
- Optimising too many parameters simultaneously: Each additional free parameter exponentially expands the space of curve-fitting opportunities. Keep your strategy simple.
- Ignoring transaction costs in IS optimisation: Always include realistic commissions, slippage, and funding costs in your IS optimisation — otherwise you will find parameter sets that generate hundreds of trades whose gross return is destroyed by costs.
Walk forward testing does not guarantee future profits — nothing does. But it is the most honest stress test available for an algorithmic strategy. If your strategy cannot produce a positive walk forward equity curve, it almost certainly cannot produce live profits either.