
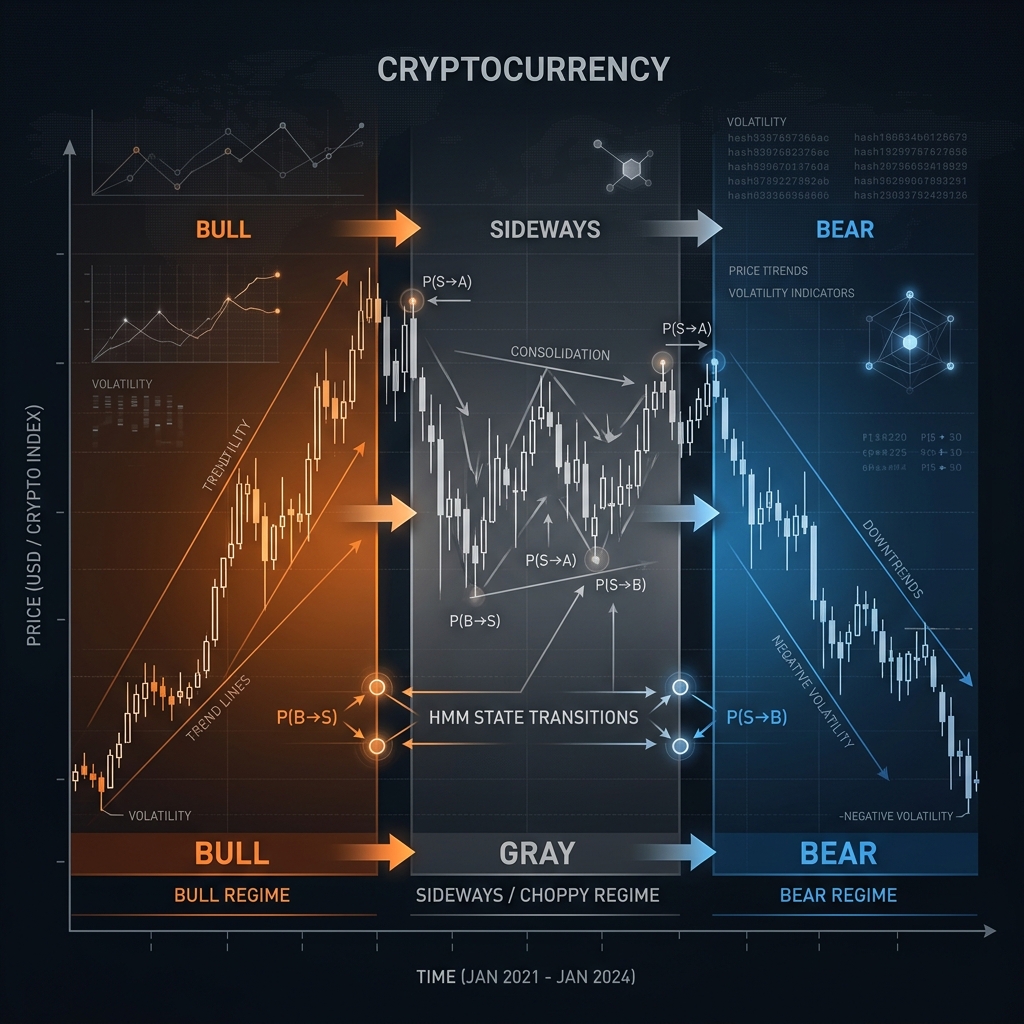
Here is one of the most important and most ignored facts in quantitative trading: no strategy works in all market regimes. A strategy built for trending markets will haemorrhage money in choppy, mean-reverting conditions. A mean-reversion strategy will be destroyed by a sustained directional trend. And a strategy designed for low-volatility conditions will be sized inappropriately and dangerously during a volatility spike.
Regime analysis is the discipline of identifying, classifying, and responding to these distinct market states. It is not about prediction — it is about observation and adaptation. The market tells you what it is doing; your job is to listen carefully enough to act accordingly.
What Is a Market Regime?
A market regime is a period during which the statistical properties of price action are sufficiently stable and distinct from other periods that they warrant different trading behaviour. The three most fundamental regimes are trending (directional momentum dominates), mean-reverting (price oscillates around a central value, excess moves are quickly corrected), and high-volatility (large, rapid price moves in either direction, often during uncertainty or news events).
In crypto specifically, we also identify two additional regime subtypes that are particularly impactful: the liquidity crisis regime (spreads blow out, order books thin dramatically, normal correlations break down — characteristic of events like the FTX collapse), and the euphoria regime (sustained positive funding rates, increasing open interest, strong spot-perpetual premium — often preceding local market tops).
Quantitative Regime Detection Methods
1. Hurst Exponent — Trending vs. Mean-Reverting
The Hurst exponent (H) is a statistical measure of a time series' tendency to trend or mean-revert. H > 0.5 indicates trending behaviour (persistence — large moves tend to be followed by moves in the same direction). H < 0.5 indicates mean-reversion (anti-persistence — large moves tend to be followed by reversals). H = 0.5 is a random walk.
We calculate rolling Hurst exponents across multiple timeframes (1h, 4h, 1d) for each major trading pair. When H consistently reads above 0.6 on the 4h timeframe, we classify the market as trending and weight our momentum signals more heavily. When H drops below 0.45, we switch to mean-reversion signals and significantly reduce position sizes on momentum strategies.
2. Hidden Markov Models (HMM) — Statistical Regime Classification
Hidden Markov Models are a class of statistical models that assume an observable sequence of data is generated by an underlying sequence of hidden states. In a market context, the observable data is returns and volatility; the hidden states are the regimes we want to identify.
An HMM trained on crypto market data typically identifies three to four latent states that correspond remarkably well to intuitive regimes: a low-volatility trending state, a high-volatility trending state, a low-volatility choppy state, and a crisis/liquidation state. The model produces not just a current regime classification but a probability distribution over all states — which is more useful than a binary classification for practical trading decisions.
3. Volatility Regime Detection via Realised vs. Implied Volatility
Comparing realised volatility (what the market has actually done) to implied volatility (what options markets expect it to do) is a powerful regime signal. When implied volatility significantly exceeds realised volatility, the market is 'paying up for protection' — typically a sign of uncertainty preceding a potential large move. When realised consistently exceeds implied, the options market has underestimated actual movement — often seen during cascading liquidation events.
Building an Adaptive Trading System
Regime detection is only valuable if it feeds into trading decisions. An adaptive system must define, for each detectable regime, what trading behaviour is appropriate. This is not about switching between completely different strategies — that introduces excessive complexity and transition costs. It is about adjusting signal weights, position sizes, and risk parameters continuously as the regime classification evolves.
- Trending regime (H > 0.6, HMM in trending state): Increase weight on momentum signals, extend holding periods, widen profit targets, tighten stop-losses on reversals.
- Mean-reverting regime (H < 0.45): Reduce or disable momentum signals, activate mean-reversion signals, shorten holding periods, take profits earlier.
- High-volatility regime: Reduce all position sizes by 50–70%, widen stops to avoid being shaken out by noise, avoid new entries during the most volatile periods.
- Euphoria regime (funding > 0.1% per 8h, rising OI): Apply short bias to new signals, reduce long exposure, hedge existing longs with OTM puts if available.
- Liquidity crisis: Immediately reduce all positions to minimum, shift to cash or stablecoins, do not attempt to 'buy the dip' until liquidity normalises.
Regime Persistence and Transition Probabilities
One of the most practically valuable outputs of HMM-based regime analysis is the transition probability matrix — the probability of moving from one regime to another in the next time period. In crypto, we have observed that trending regimes tend to be persistent (once established, they continue for multiple weeks), while the liquidity crisis regime is typically short-lived but intense (days to a few weeks).
Knowing that you are currently in a trending regime with a 78% probability of remaining there next week allows you to make very different positioning decisions than if you are in a choppy regime with a 50% chance of transitioning to a trend or reversing. Transition probabilities turn regime analysis from a static classification into a dynamic probabilistic framework.
“The market does not owe you consistency. It shifts regimes without warning and without apology. Your strategy must be capable of recognising these shifts and adapting, or it will be a strategy that works until it suddenly, catastrophically, doesn't.”
Practical Implementation at StockHunt
Our live regime detection system runs a three-model ensemble: a rolling Hurst exponent calculator, an online HMM with continuous parameter updates, and a proprietary volatility regime classifier built on realised-to-implied volatility ratios supplemented by funding rate and open interest signals. The ensemble outputs a continuous regime probability vector that is fed directly into our signal weighting and position sizing engine every 15 minutes.
The result is a system that behaves materially differently across different market conditions — not because a human manually intervened and changed the strategy, but because the quantitative framework is continuously adapting to the market it observes. In our live performance data, regime-adaptive position sizing has reduced maximum drawdowns by approximately 30% compared to fixed-size deployment of the same signals.
Regime awareness is not an advanced trading concept — it is a prerequisite for strategy survival. Before you ask 'does my strategy work?', ask 'what regime is my strategy designed for, and how will I know when the market is in a different one?'